Events can primarily be divided into two categories – micro and macro events, as well as lead and purchase events. This is the simplest and most effective distinction, which is useful during the planning process.
Macro events represent conversions, which are the main goals/objectives of your website. If you run an e-commerce store, a macro event could be a purchase or even the initiation of the checkout process. On the other hand, if your primary goal is lead generation via your website, then a macro event in this case would be form submission or scheduling a phone call through a contact widget.
Micro events are less significant activities that ultimately lead to the achievement of macro events. For example, a micro event on an e-commerce site could be viewing a product page or adding an item to the cart. In a lead-focused website, micro events might include copying an email address or clicking a linked phone number.
This distinction between micro and macro events allows you to focus on potentially interesting events according to a detailed or general scheme. This reduces the risk of overlooking any events during the planning process.
The distinction between lead and purchase events is introduced because purchase events need to be configured according to existing Google guidelines. Otherwise, sales data cannot be collected in Google Analytics 4, one of the most important marketing tools.
Now that you know the categories of events, you should also know that there is a Google documentation [1] on measuring e-commerce, where you’ll find a list of recommended events. Take a moment to sit back with a cup of coffee, pull up your website, and try to walk through key processes – fill out a form, place a test order, or subscribe to the newsletter. Focus on the steps in these activities that are worth monitoring.
Include all events in your measurement plan that occur along the path to achieving your website’s main objectives. What’s the benefit? You’ll be able to analyze where users are dropping off and not completing conversions. The data will help you identify the problem’s source, and this knowledge will inspire you to come up with solutions.
We take an individualized approach to each website. However, some universal sets of events can be applied to most websites.
Key event set for lead generation-focused websites:
Key event set for sales-focused websites:
By monitoring events, you can analyze data and effectively optimize paid activities. Therefore, events should be sent to GA4, but also to the platforms where you run campaigns (e.g., Meta Ads, TikTok Ads, Google Ads). How does this work?
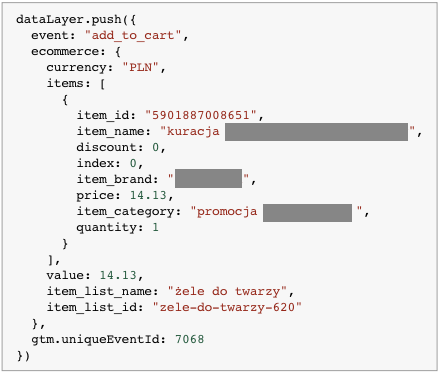
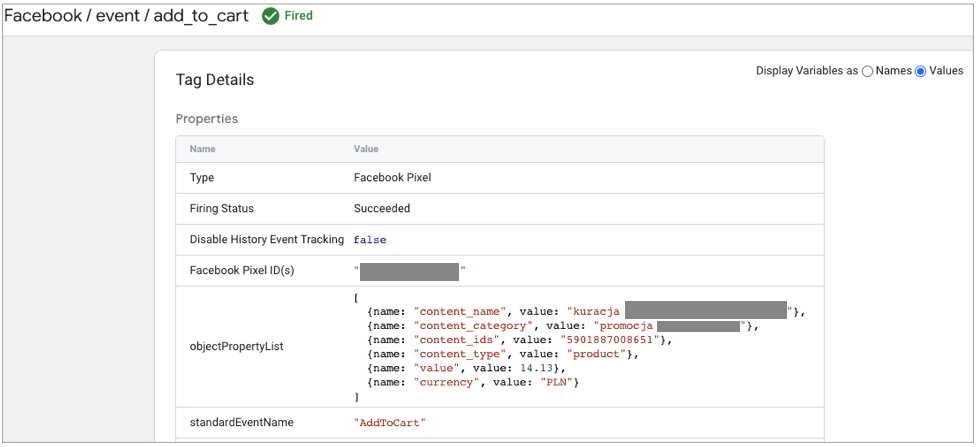
One of the quickest and easiest methods is using Google Tag Manager (GTM), where you can configure event tracking and send the related data to various tools. For e-commerce sites, you’ll also need a dataLayer. This is a data layer on the site that will be provided by your developers, a built-in integration in the shop panel, or a plugin. How does it work? When, for example, a product is added to the cart, the necessary data related to this event is stored in the dataLayer. Then, using Google Tag Manager, you can send this data in the appropriate format to the selected tools.
<p”>Data is sent via the configuration of tags, variables, and triggers in GTM. Each tool to which we want to send events strictly defines what and in what format should be included in the event structure. Below are examples related to the add-to-cart event.
The first screenshot shows the dataLayer that „exposes” data for the tags in GTM. The second screenshot shows the data that, based on the dataLayer, was sent to Meta via a previously configured tag.
Event configurations can be time-consuming and sometimes quite complex. If you don’t have the time or the inclination to study technical documentation, be sure to delegate the configuration to someone experienced.
By sending event data to tools like Meta or Google Ads, you gain insight into statistics. From within these tools, you can observe the results of your paid activities and effectively optimize your campaigns. However, keep in mind that you’re only looking at the behavior of users who came to your site via a specific ad system. Moreover, such tools typically don’t offer deep analysis or alternative data visualizations.
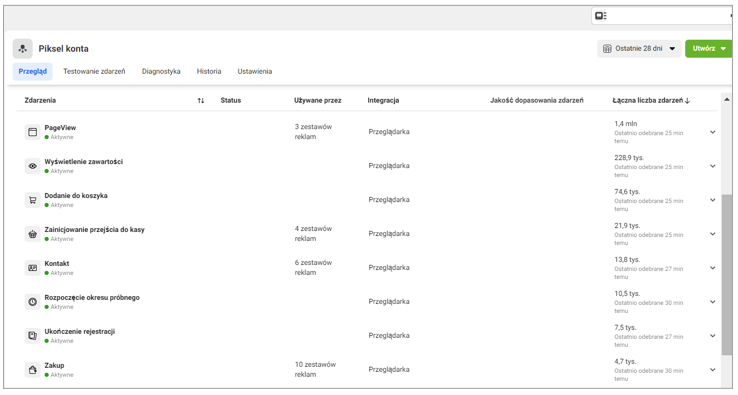
Below is an example of user behavior data from a website in the Meta Ads system.
To thoroughly analyze user behavior, you need to review data in GA4. You can then extend your research with additional tools – but one step at a time. GA4’s basic reports offer several sections where you can analyze event performance. Here are a few examples.
Traffic Acquisition Report
This is where you’ll find the number of events attributed to specific traffic channels. Adjust the data to suit your needs. You can freely change dimensions to be more general or detailed, as well as choose metrics – analyze the total number of events or select a specific event from the dropdown list.
If the events you’re interested in are marked as conversions, make sure to edit the report and add session conversion rate to the metrics displayed in the table. This will help you understand which traffic sources are most valuable to your business and allow you to adjust your marketing budgets accordingly. The higher the conversion rate, the better – it reflects the percentage of sessions in which your website’s goals were achieved.

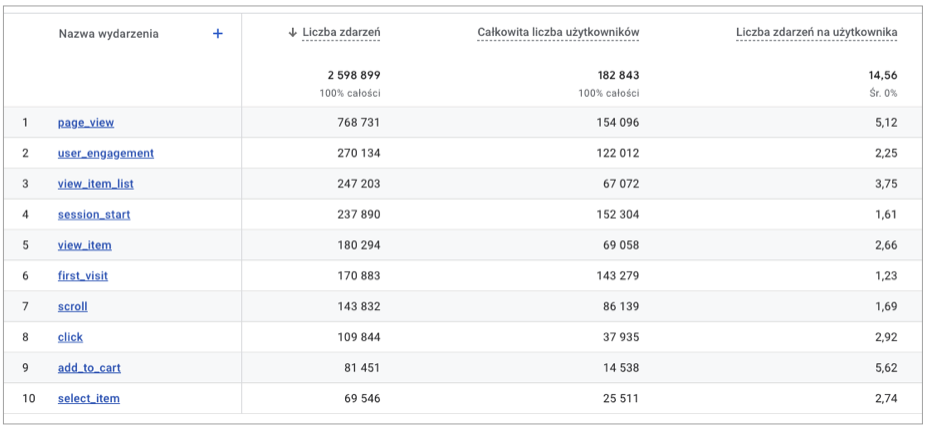
Events Report
In this section, you can check which events are most popular on your website. The list will also include automatically tracked events by GA4, such as page_view or session_start.
A particularly useful metric here is events per user. This metric can help you identify issues in the process of achieving your website’s goals. For example, if a form is being filled out multiple times by users, it could indicate an error during form submission, leaving users unsure if their data was successfully sent.
After your initial analysis of this metric, you’ll also be able to spot any oversights, such as events being tracked without restrictions, when they should only be tracked once per page/session.
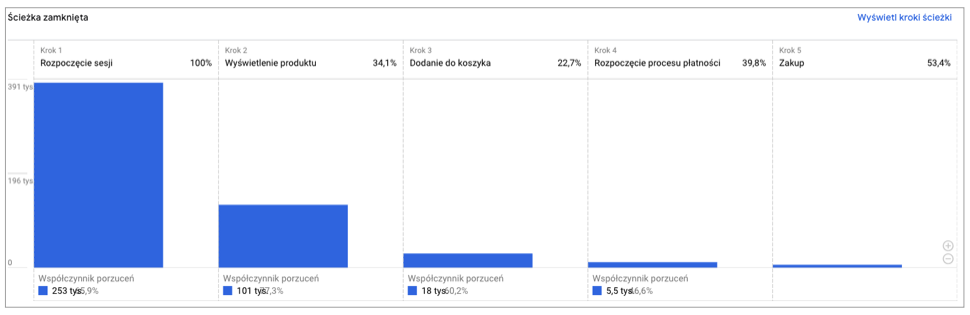
Purchase Path and Payment Path Reports
These essential data visualizations for e-commerce – which, in addition to identifying potential issues, also illustrate the scale of the problem – can be found in the Revenue Generation section. Here, you can view the user path to purchase broken down into two levels of detail.
The Purchase Path Report tracks the journey from session start, to viewing a product, adding an item to the cart, starting payment, and ultimately completing the purchase.
The Payment Path Report tracks the journey from initiating the payment process, to entering shipping information, to adding payment details, and finally completing the purchase.
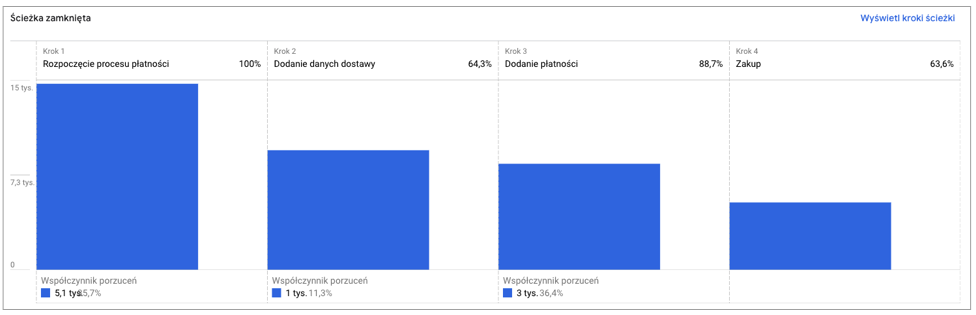
Both reports show where the most users drop off along the purchase path. Through in-depth analysis of this data, you can identify the steps in the process that need improvement.
When reviewing the bar chart statistics, remember that these two reports use a „closed funnel” approach. Google defines it as follows: A closed funnel only contains data for users who completed the given step. Users are only counted for steps in the funnel that they completed in the specified order. If a user skips a step, they exit the funnel and aren’t counted in subsequent steps [2].
In Exploration reports, you can create similar funnels, including open ones. Importantly, funnel creation is simply based on creating a list of events. Therefore, you can also create an event funnel for a lead generation website. The funnel might consist of the following steps: starting to fill out a form, providing an email address, checking consent boxes, clicking „Send Form,” and confirming form submission.
After reading the above text, you now know that you can track various user behaviors in the form of events. You’re familiar with their types/categories and ready to create a measurement plan for your website. You also know a few reports in GA4 worth checking out to find valuable numerical insights. But how do you connect this data to actionable insights for your business?
Create actionable insights – combine your analysis conclusions with recommendations that point toward actions and opportunities that contribute to your business’s growth. For example: imagine you see the following data in the Purchase Path report: 72,550 users viewed a product page, but only 5,120 added a product to the cart. You conclude that during the analyzed period, 93% of potential customers abandoned the purchase path after viewing the product. This conclusion alone doesn’t yet provide value to your business; it merely identifies an existing problem. The key is to plan further analyses to identify the cause of the problem and generate actionable ideas to solve it. This is when you turn your conclusions into actions – creating actionable insights.
What could be the next steps in this example?
I’m confident that with such an in-depth analysis, you’ll provide your superiors with a solid report containing valuable and specific recommendations for action. Reducing UX errors, highlighting the right brand values, and improving your offer relative to competitors will ultimately contribute to growth in: returning users, conversion rates, engagement, and – most importantly – revenue.
Online Sources:
[1] https://developers.google.com, accessed on 22.09.2023
[2] https://developers.google.com, accessed on 22.09.2023
[3] https://developers.google.com, accessed on 22.09.2023