Differences Between Navigation Panels in GA3 and GA4 – What Reports Are Missing?
The GA3 navigation panel was certainly more comprehensive than that of GA4, meaning it included more detailed reports. There are many differences, but right away, you can notice that key reports such as Age and Gender, Source/Medium, Referrals, or Site Search are missing in the new version.
Despite the lack of ready-made reports, all the data previously displayed in these reports is still available in GA4. You can filter it through other reports or create custom dashboards.
Why Is Collecting and Analyzing This Data So Important? First and foremost, you’ll get to know your audience. This knowledge allows for effective segmentation, enabling you to quickly and efficiently reach specific audience groups with personalized communication. You’ll also be able to identify users who abandoned their shopping carts and take the appropriate actions to close the sale. Moreover, you can continuously monitor your website’s usability and spot potential navigation issues for users. There are many ways to analyze the collected data, and you can gain a wealth of information. It’s crucial to be aware of this, regularly use GA4 reports, and turn insights into effective and profitable business decisions.
Explore the Potential of the New Interface – Customize Reports to Your Needs!
GA4 offers users basic reports as well as the ability to edit them and create custom views. This flexibility allows you to tailor all reports so you can quickly and efficiently access the information you need. While this flexibility may seem daunting at first, once you take your first steps in report editing, you’ll realize how essential and beneficial this feature is. Let’s walk through some key data step by step.
Age and Gender
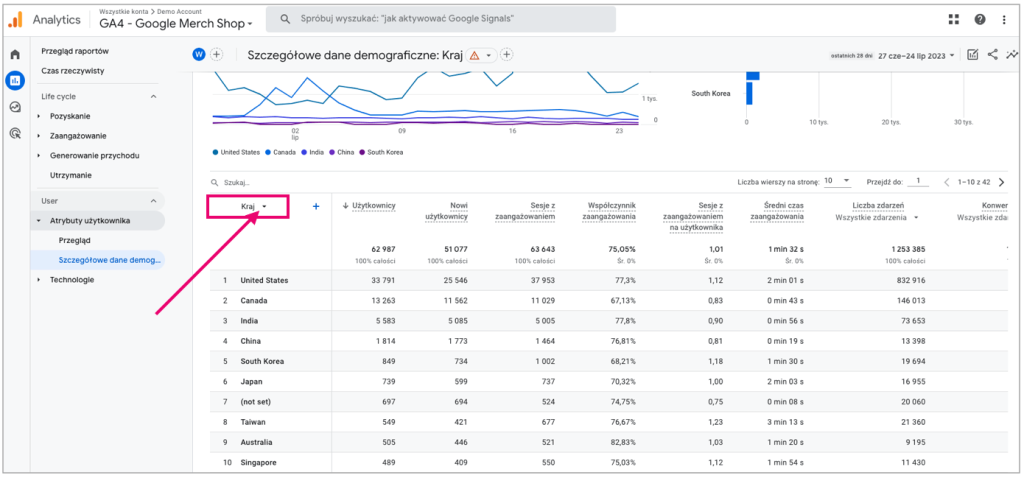
In GA3, the demographic data section was divided into an Overview and separate reports for Age and Gender. In GA4, there’s the User Attributes section, which includes an overall summary, Audiences (analysis of the groups you target with ads), and Detailed Demographics. This is where you can filter data by age groups and gender. Navigate to the Country column, click the selection icon, and choose another dimension.

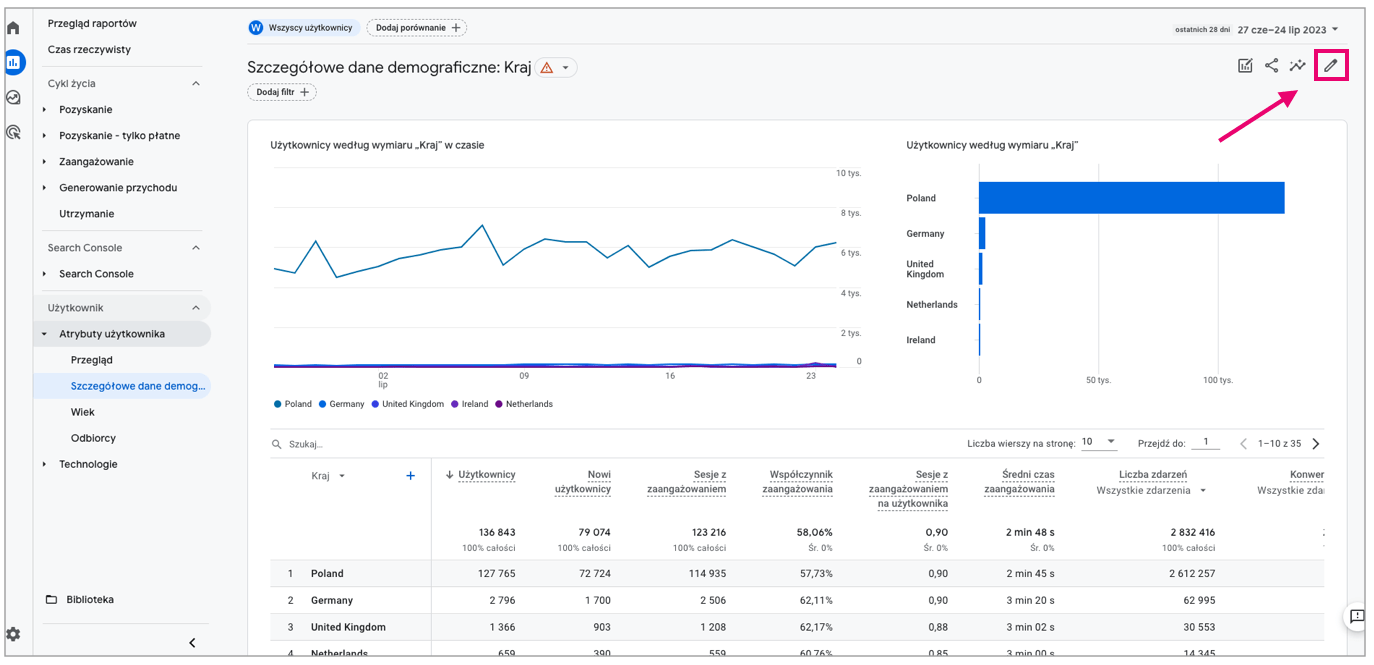
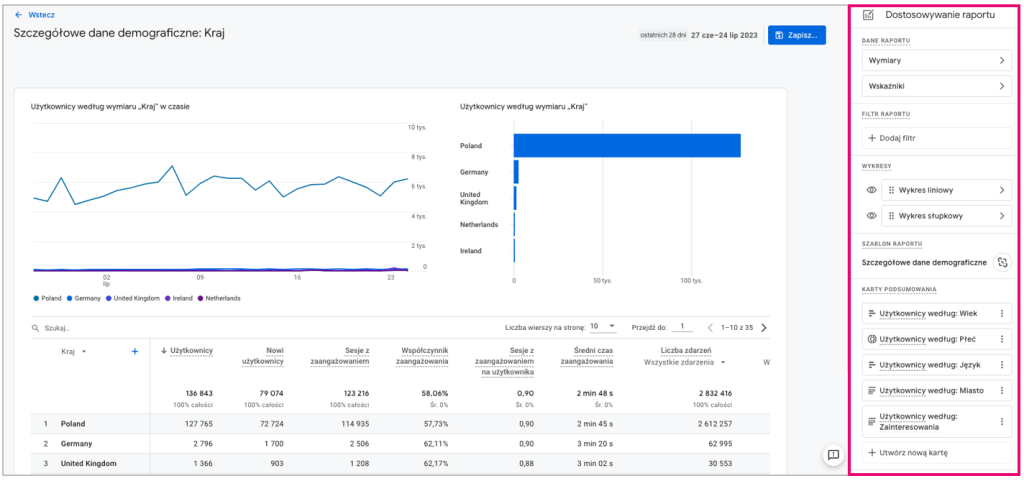
To avoid doing this every time, you can create two additional reports under Detailed Demographics: Age and Gender. Publishing these in the reporting panel will ensure access for all users. Click the pencil icon in the top right corner of the current report to enter edit mode.

Follow these steps:
- Go to Dimensions.
- Set Age as the default (click the three vertical dots on the right of the tile and choose the appropriate option).
- Click Apply.
- Click Save and choose Save as New Report.
- Name the report (Fun fact – you can use emojis in the report title 🙂).
- Go to Library (at the bottom of the navigation panel under Reports).
- Find the collection named User, enter its edit mode.
- Drag your report into the collection and click Save.
Done! The report is now visible in the navigation panel. Follow the same steps to add the Gender report. Additionally, you can:
- Add new dimensions to the dimension list,
- Add new metrics to the metrics list,
- Change the order in which dimensions and metrics are displayed,
- Apply a data filter to the selected dimension,
- Change chart types, reorder them, or hide them from view,
- Unlink the report from the template (when linked, Google updates will apply changes to the report),
- Edit or add widgets that appear in the overview,
- Save changes to the current report (if making major changes, it’s recommended to save the report as new).
source: own account
What Business Value Do These Data Hold?
Demographic data like age, gender, location, and interests help you understand who your actual audience is and which groups convert most often. Analyzing this data allows you to segment users, enabling faster and more effective targeting of personalized messages. Remember, to access demographic data, you need to enable Google Signals in your service settings.
Source/Medium and Referrals
You can find these data points in the Acquisition section, under the User Acquisition and Traffic Acquisition reports. The first presents data only for new users’ first sessions, while the second provides data for all sessions from all users. As with demographic data, you can filter the data you’re looking for here as well. Referrals are crucial data to check regularly, so it’s worth creating a dedicated report for them.
Here’s how:
- Go to Dimensions.
- Set Source/Medium as the default (click the three vertical dots on the right side of the tile and select the appropriate option).
- Set a filter to show only referral sites in the Source/Medium dimension (choose dimension: Sessions – source/medium, enter the value “referral,” and select All values containing “referral”).
- Click Apply.
- Click Save and choose Save as New Report.
- Name the report.
- Go to Library (at the bottom of the navigation panel under Reports).
- Find the collection named Acquisition, enter its edit mode.
- Drag your report into the collection and click Save.
source: own account
Done! To create the Source/Medium report, follow the same steps, skipping step 3.
What Business Value Do These Data Hold?
Detailed traffic analysis allows you to observe how paid activities compare to organic traffic, which sources provide more value, and where further investment may be needed. Additionally, you can ensure that your paid media team is tagging links according to Google’s guidelines and that sources are correctly attributed to GA4’s default channels.
When configuring your service, exclude all domains for email services and payment gateways (in e-commerce). It’s safe to say that configuring analytics is never a finished task. Therefore, it’s important to regularly check the referral report and exclude sites that shouldn’t be classified as traffic sources (e.g., typeform.com when using embedded surveys on your site).
Site Search
In GA3, this report tracked site search dynamics and the terms entered by users. While GA4 automatically logs events related to site search, there is currently no ready-made report for this area.
To create one:
- Leave the Reports section and go to Explorations (the next tile in the panel under Reports). This is where you can create deeper analyses and more advanced data visualizations.
- Choose Create New Exploration (Blank).
- In the Variables column, add the following dimensions: Event Name, Search Term, and Page Location.
- Add data: Event Count.
- In the Tab Settings column, select Search Term and Page Location under Rows.
- Increase row visibility to 500 using the Show Rows option.
- Place Event Count under Values.
- Finally, create a filter: Event Name contains view_search_results.
Done! This report will display search terms used on your site, the pages where searches occurred (URLs), and the number of search events.
What Business Value Do These Data Hold? By regularly analyzing this report, you can track user trends, interests, and needs. This in-depth analysis helps you stay on top of the user experience with your website’s interface. For instance, one of our new clients came to us after a recent website redesign. The Contact tab was removed from the menu, and since then, the dominant search term—never used before—became „contact.” The analysis clearly indicated that users were struggling with navigation, and the issue needed to be addressed.
Use GA4 Wisely – Familiarize Yourself with Dimension and Data Definitions
When editing/creating reports or analyzing data, it’s essential to know what you’re analyzing—how it’s calculated and what the term means. Google has provided a list of all dimensions and metrics included in GA4, along with detailed definitions. It’s worth reviewing this document before starting work in the panel.
For example, in GA3, the metric Users refers to all users who visited your site within a given period. In GA4, however, the term Users refers exclusively to Active Users, i.e., those with engagement sessions. To check the equivalent of Users from GA3 in GA4, look for Total Users.
Key Takeaways and Expert Tips
- Remember that making business decisions without analyzing your site traffic data involves unnecessary risk. Take advantage of GA4’s potential—analyze, create reports, explore. The knowledge you gain will help you understand your audience, effectively target ads, optimize your user interface (UI), close sales, and generate more leads.
- GA4 does not include all the reports you may be familiar with from GA3. Missing reports include Age and Gender, Source/Medium, Referrals, and Site Search.
- Don’t get discouraged if you can’t find a report exactly like in GA3. The data you’re looking for is likely available—you just need to extract it from GA4.
- GA4 encourages user flexibility and creativity—you can edit existing reports and create custom data views.
- You can work with data by editing and creating reports in the basic report panel or by conducting in-depth analyses in the Explorations section.
- Dimensions and metrics in GA4 differ from those in GA3. The new platform has different methodologies and terminologies. You can find a full list on Google’s support page—make sure to review it before starting any work in GA4.

Over de auteur
Katarzyna Góraj
Senior Digital Analyst
Haar eerste stappen op het carrièrepad zette ze in social listening, waarna ze volledig opging in de wereld van onderzoek. Bij Yetiz houdt ze zich bezig met analytics, maar ook met het voeren van PPC-campagnes. Privé is ze verslaafd aan bergwandelingen en kan ze zich geen leven voorstellen zonder de stem van Freddie Mercury.


